Accumen Performance Suite 2.1.2

Product Release Notes
Accumen Performance Suite®
2.1.2
April 2023
Product Detail and Version
Product Name | Version | Date | Comment |
|---|---|---|---|
Accumen Performance Suite | 2.1.2 | April 2023 |
Revision History
Date | Version | Description | Author |
|---|---|---|---|
04/13/2023 | 1 | Release Notes | Celena Blackwood |
Feature Release list contained in Version 2.1.2
New + Improved
Optimization of Summary Metric Counts
Mapping Status on Landing Page
Mapping Enhancement
Advance View for Data Mapping Page
Share View Optimization
Lab Quality and Service Metric Hiding
Day Selection Enhancement Schedule Excellence Modules
Seed Data Failure Update
Login Error Messages Update
Integration of HTML editor into Business Logic
Basic Benchmarking Demo
PBM trend line toggle limitation (Defect)
Patient Care Facility Mapping (Defect)
Unmapped count on Mappings (Defect)
Detailed Product Release Description
1. Optimization of Summary Mapping Counts
Code has been implemented to decrease load times for the summary mapping screen. This will also have an impact on the additional mapping screens load time. All mapping screens will have a decreased load time.
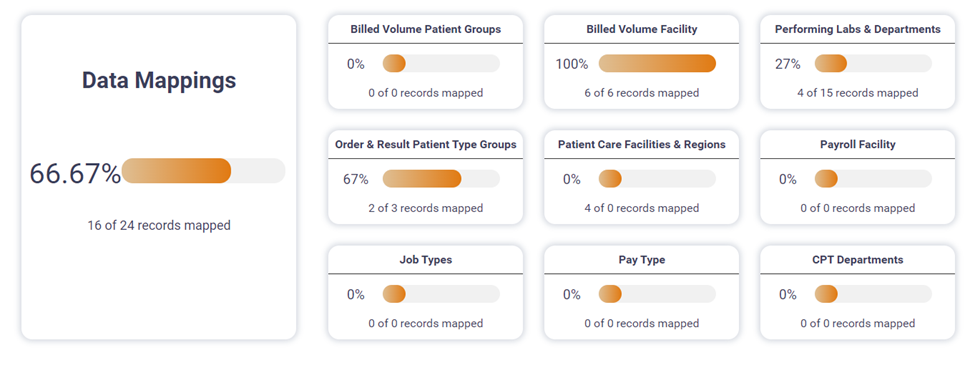
Figure 1- Summary of Mapping Counts
2. Mapping Status on Landing Page
From both the PBM and Lab Analytics landing page the user will be able to see the status of data mappings.

Figure 2 – Lab Anayltics Landing page Mapping Status

Figure 3 – PBM Landing page Mapping Status
3. Mapping Enhancements
Currently when PBM clients are transferred from the Staging to Production environments intervention of administrator is needed to update facility and target mappings. Enhancements are now available so all data in both CONFIG facilities and mappings can be duplicated in Production by a user with adequate permissions.
Utilizing the 3-dot menu the user can download the data in csv format.
The file is saved.
Navigate to Production client configuration.
Utilize the 3-dot menu and upload the saved csv file.
A spinner will appear while request is being submitted.
Complete data validation to ensure the UI mirrors staging data.
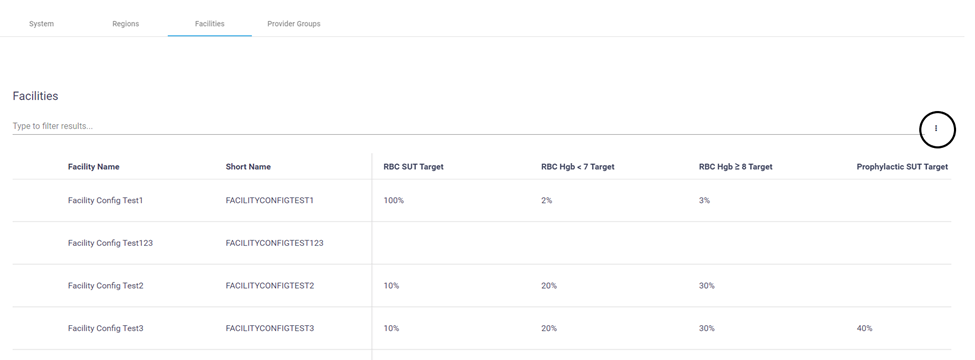
Figure 4- Configuration Facilities Mapping page 3-dot menu

Figure 5- Configuration Facilities Mapping page Download/Upload Options
4. Advance View for Data Mapping Page
The addition of this feature will allow the user access to understand data changes. Toggling the Advance View on the data mapping page will display the modified by and modified date column for the last time a mapping was updated. The feature is available for all data mappings in all modules. The columns are filterable and sortable.
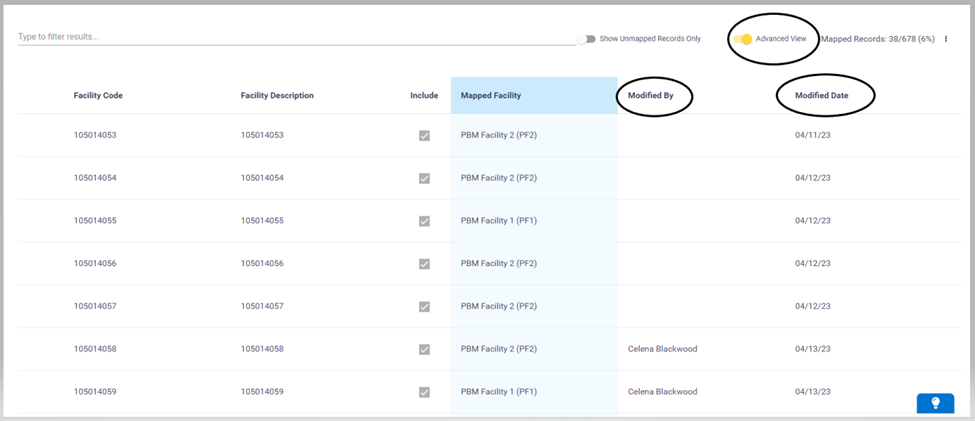
Figure 6- Advance View Data Mapping Screen
5. Share View Optimization
Share View and Share Workbook have been combined into one Share option under the 3-dot menu. When Share is selected the default view and any saved views will appear for selection. Views may be selected individually or “select all” may be utilized. The attachment type options and inputs remain unchanged.
Select Share from the 3-dot menu.
Input the Subject.
Select the Attachment Type (PDF, PNG, PowerPoint).
Select the views to be attached.
Enter a Comment.
Enter email addresses for recipients in “Share To” section.
Click Send to complete the share function.
Click Cancel to abort the action or to save a draft for later.
Saved Drafts are located under the administrative menu.
Administrative > Message Center> Drafts
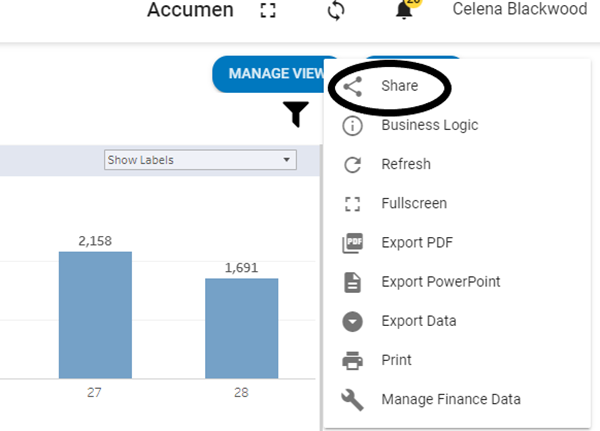
Figure 7- Share Function under 3-dot menu
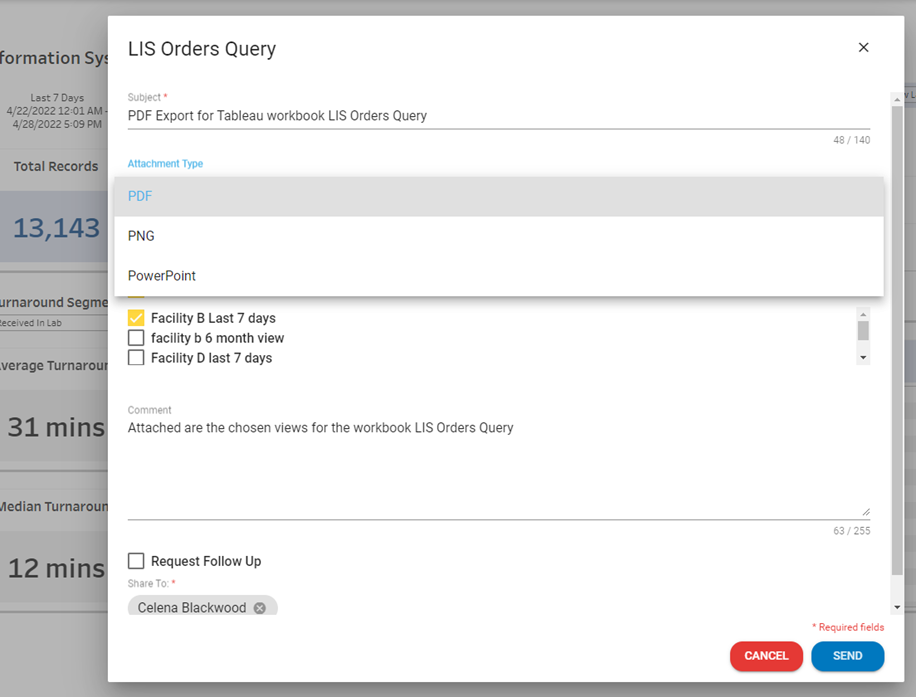
Figure 8- Attachment Options under Share Function
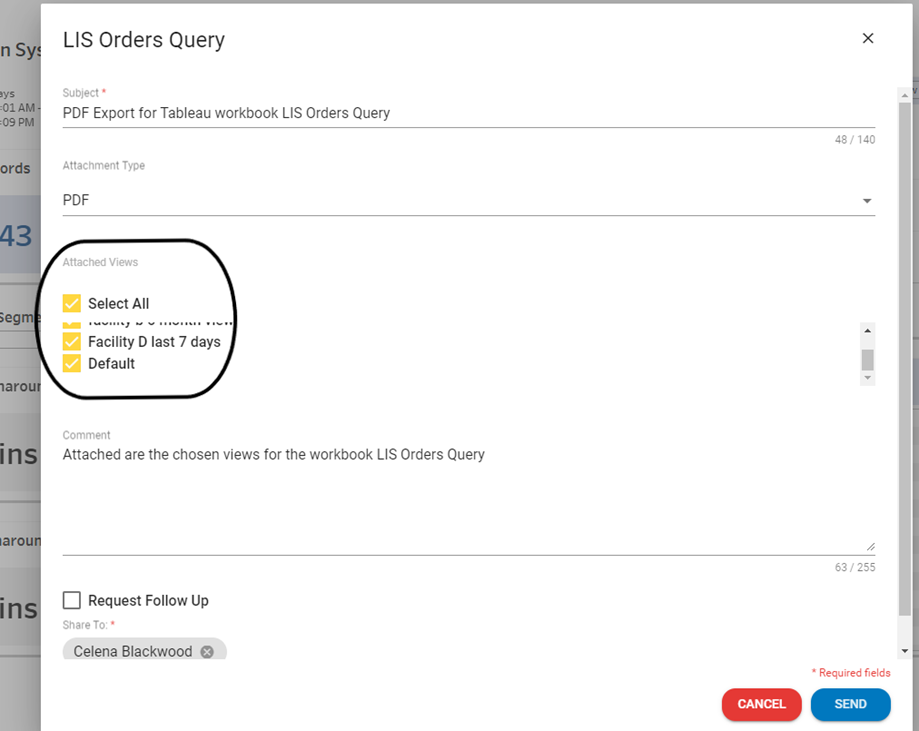
Figure 9- Views selection of Share Function
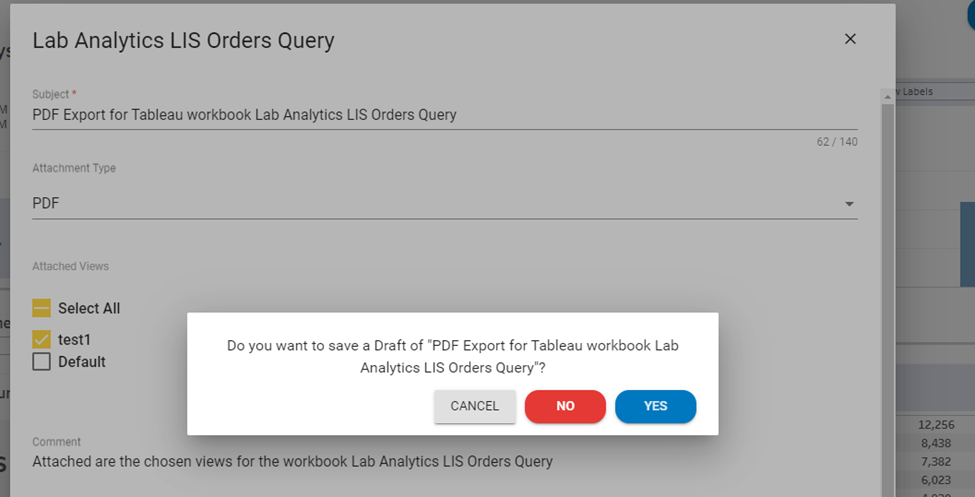
Figure 10- Saving a draft under Share Function
6. Lab Quality and Service Metric Hiding
For users not utilizing all metrics on the Laboratory Quality and Service Detail Module there was no way of hiding metrics from the view. An enhancement has been added with this release.
Click the “X” to the left of the metric to hide it from view.
Save the View to maintain changes.
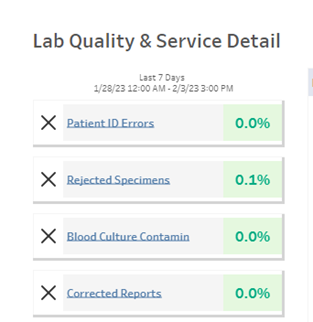
Figure 11- Lab Q&S Detail Metrics
7. Schedule Excellence Module- Day Selection Enhancement
In all three schedule excellence modules “Day” is multiple selection capable. This allows the user to visualize multiple days on the graph similar to the LIS Orders Query functionality. This allows users to overlay Draws, Accessions, or Tests, depending on the selected module, across multiple days.
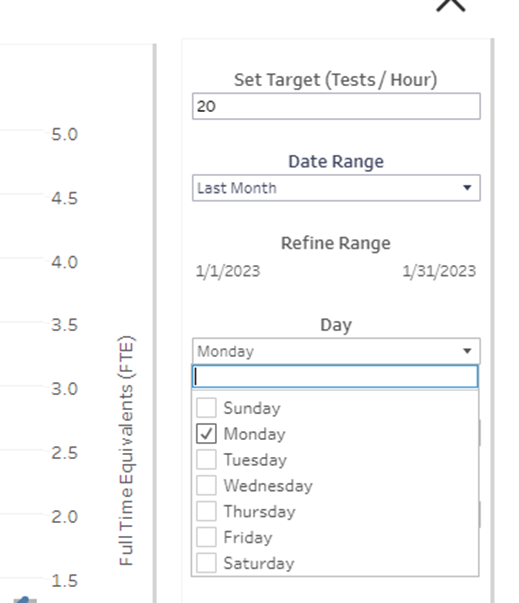
Figure 12- Multiple Day Selection Option – Schedule Excellence Modules
8. Seed Data Failure Update (Applicable to Limited Users)
Previously if there was failure when clicking on the Seed Data Sync Icon there was no message. Pop-up messaging has been added, “Seed Data Sync could not be initiated.”
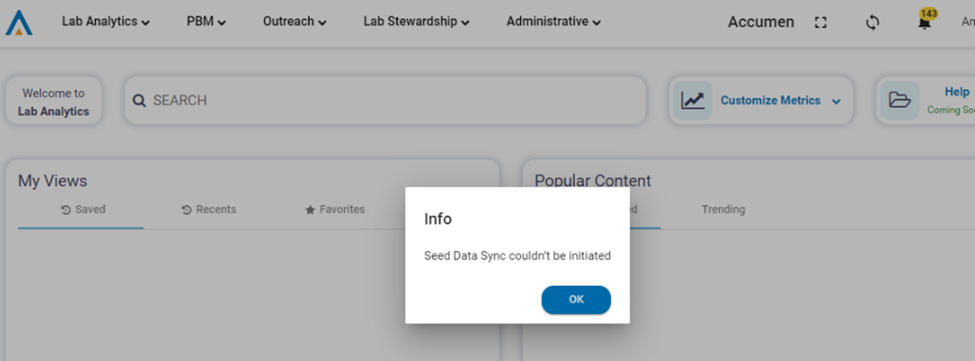
Figure 13- Seed Data Error Message
9. Log In Messages
Previous versions of APS contained one generic error message at login stating the account has been locked. Messages have been enhanced to be more insightful based on the type of error that has occurred.
Authentication failure – “Incorrect Username or Password. <contact info>”
Unable to connect to the API – “Couldn’t connect to server. <contact info>”
Internal Server Error or Unknown Error – “Server couldn’t complete request. <contact info>”
User not active – “Your account has been locked. <contact info>”
10. Integration of HTML Editor - Business Logic
Users with the administrative access now have additional formatting options compared to previous software versions when updating client’s business logic tab. The feature offers the flexibility to enter tables and enhanced formatting allowing clients better visualization of metric definitions, targets, and caution values.

Figure 14- HTML Editor Options
11. Basic Benchmarking Demo (QA & Staging)
Demonstration pages for basic benchmarking have been added to the QA and Staging environments providing users the ability to see preliminary features. Demonstration Only.
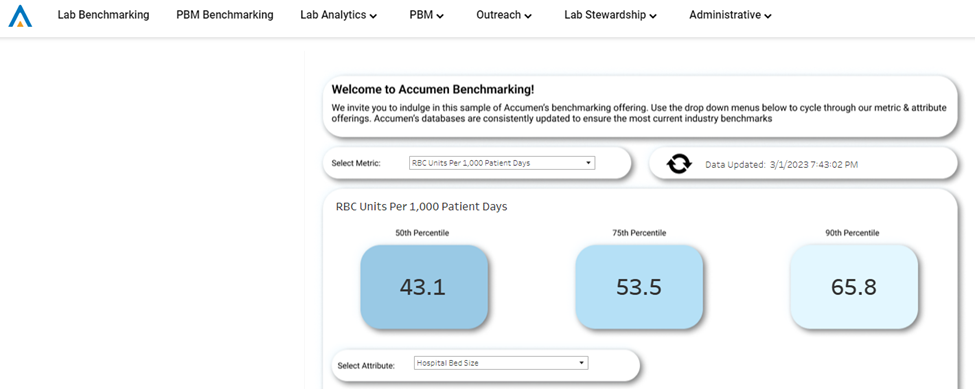
Figure 15 – PBM Basic Benchmarking
12. PBM Trend Line (Defect)
The ability to adjust trend line in both directions has been restored to the software.

Figure 16 – RBC Metric Trend Line Toggle
13. Patient Care Facility Mapping (Defect)
Changes to patient care mappings were not saving. The error has been resolved and applying new mappings will be updated accordingly.
14. Unmapped Count on Mappings (Defect)
The unmapped count of the mappings screen has been updated to include only unmapped data results. Any excluded data will not be counted as “unmapped”.
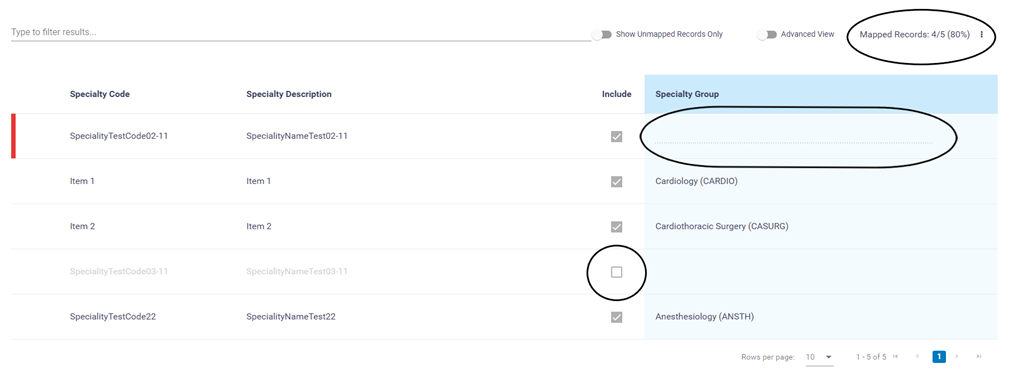
Figure 17-PBM Data Mapping Screen
Downloads
© Accumen Performance SuiteThis document represents proprietary information and neither it nor its contents may be disclosed to anyone without the specific permission of Accumen, Inc. |
|---|
